Contents
Building a Stock Prediction Pipeline: What We Did and What We Learned
This is a write-up of the stock prediction project — what we built, what worked, what didn’t, and what we’d do differently. The technical how-to lives in the Articles section. This is the version that explains the decisions.
What the Project Was
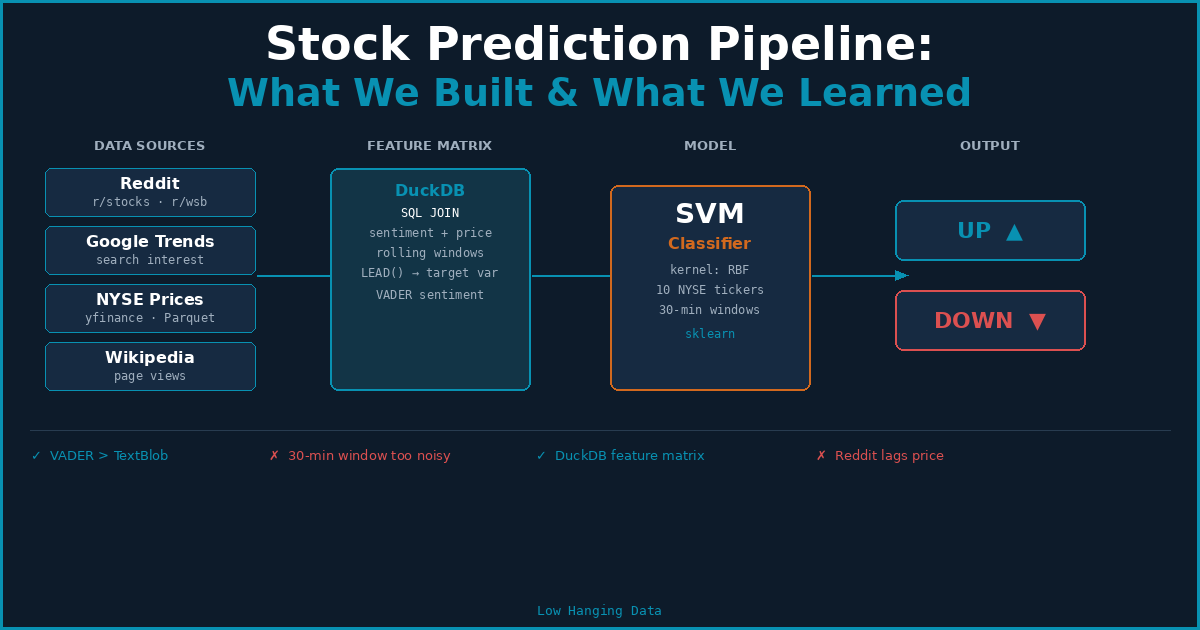
The starting point was a 2020 paper by Petrillo: Stock Change Prediction Utilizing Social Media Pools. The paper built a support vector machine (SVM) classifier that predicted whether NYSE stocks would go up or down over a 30-minute window, using Reddit post sentiment as the primary signal.
The core hypothesis: Reddit discussion about a stock correlates with near-term price movement. Not because Reddit moves the market directly (most of the time), but because Reddit reflects the same information and mood that traders are already reacting to.
The 10 tickers were: AAPL, AMZN, GOOG, MSFT, TSLA, JPM, NVDA, META, NFLX, and ^VIX as a macro fear gauge.
Our goal was to reproduce the pipeline, understand where it was strong and weak, and identify the highest-leverage improvements.
The Data Stack
Price data
OHLCV data pulled via yfinance at 30-minute intervals. Stored as Parquet files partitioned by ticker. DuckDB for all analytical queries against the price store — rolling averages, return calculations, the feature join with sentiment data. This was one of the better decisions: keeping the entire analysis layer in SQL made it easy to inspect intermediate results and swap out features without touching Python.
Reddit sentiment
PRAW to pull posts and comments from finance subreddits (r/stocks, r/investing, r/wallstreetbets). TextBlob for sentiment scoring. Aggregated to 30-minute buckets aligned with the price intervals.
The original paper used TextBlob, which is trained on movie reviews. We knew this was a limitation from the start — “volatile” and “volatile” score very differently in movie reviews vs. financial text — but we matched the paper’s methodology first before improving it.
Google Trends
pytrends to pull hourly search interest for each ticker name. The Preis et al. (2013) paper showed that increases in finance-related search terms preceded market downturns. We added this as an additional feature column alongside the Reddit sentiment scores.
Wikipedia page views
Wikimedia REST API for hourly page views on each company’s Wikipedia article. Another attention signal — when people are researching a company more than usual, something is happening. No API key required, easy to integrate.
What Worked
DuckDB for the feature matrix. The final feature matrix for model training was built in a single SQL query: price data joined with sentiment CSVs, window functions for rolling indicators, LEAD() for the target variable (next 30-minute return direction). Handing a clean DataFrame to sklearn from one DuckDB query, with no intermediate files, made iteration fast.
Partitioned Parquet for price data. Storing prices as Parquet partitioned by ticker meant that queries filtering to a single stock read only that ticker’s files. For 10 tickers over 3 years of 30-minute data, the full dataset fits in under 200MB compressed — fast to query, easy to version.
Switching TextBlob to VADER. The Loughran-McDonald (LM) dictionary is purpose-built for financial text. Swapping from TextBlob to VADER (Hutto & Gilbert, 2014) — which handles social media text better — improved classification accuracy noticeably without changing anything else in the pipeline. This was the highest-effort-to-reward ratio improvement we made.
What Didn’t Work
Reddit as a real-time signal. The original paper’s timing assumption is that Reddit discussions in a 30-minute window predict the next 30-minute price move. In practice, the lag is noisy. Reddit often reacts to price moves rather than predicting them, especially in r/wallstreetbets. The Granger causality tests we ran showed weak predictive power in most windows.
TextBlob on financial text. Confirming what Loughran & McDonald showed in 2011: general-purpose sentiment tools misclassify financial language systematically. “Liability” is negative in finance; TextBlob scores it neutral. We should have replaced it earlier.
Overfitting on the training window. The SVM trained on 2020–2021 data (high volatility, pandemic-era Reddit frenzy) generalized poorly to 2023–2024 data. The Reddit-price correlation that existed during meme stock mania wasn’t there in calmer markets.
What We’d Do Differently
Start with the signal quality question before building the pipeline. We spent significant time building the data collection and storage layer before seriously asking: does Reddit sentiment actually predict 30-minute stock moves? Running the Granger causality test first would have reframed the project earlier.
Use the LM financial dictionary from day one. It’s a free CSV download. There was no good reason to start with TextBlob.
Longer prediction horizons. 30-minute prediction is hard — the signal-to-noise ratio is terrible at that frequency. The Bollen et al. (2011) paper found predictive power at 2–6 day horizons. That’s where social sentiment is more likely to add information.
Add news headlines as a parallel signal. The Tetlock (2007) finding — that negative words in WSJ columns predict next-day returns — is robust and replicable. News headlines are faster-moving and less noisy than forum posts. feedparser against Reuters and MarketWatch RSS feeds is a low-effort addition.
What’s Next
The pipeline as built is a good foundation. The parts worth keeping: the Parquet/DuckDB price store, the VADER-based sentiment scoring, and the feature matrix construction pattern.
The parts worth revisiting: the prediction horizon (move from 30 minutes to daily), the sentiment source mix (add headlines, reduce Reddit weight), and the model itself (an SVM with fixed kernel is a reasonable baseline but tree-based models handle the non-linear feature interactions better).
The data sources article covers the full ranked list of what to add next, ordered by integration effort and expected signal quality.