Contents
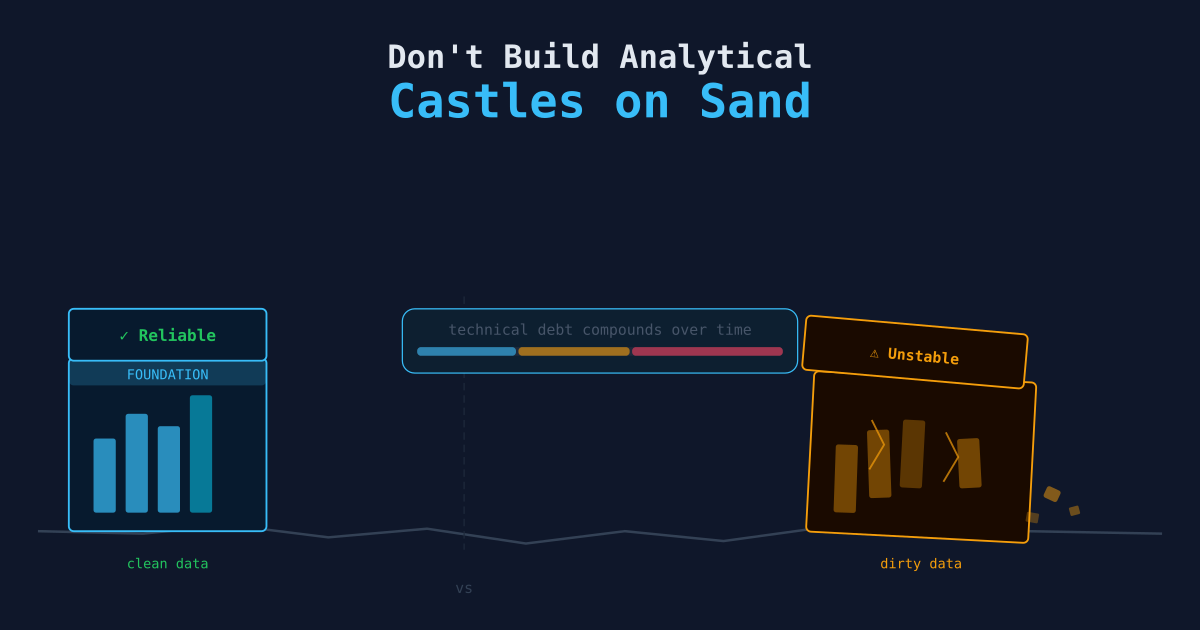
Don't Build Analytical Castles on Sand
🌳 High Hanging Fruit
Software engineers discuss technical debt constantly. Analytics teams rarely do. That asymmetry is a problem: analytical debt compounds the same way as software debt, but it fails more quietly, and the failures typically surface in a board meeting rather than a stack trace.
This article covers the patterns that render otherwise-solid analysis unreliable, and the practices that prevent them.
What Analytical Technical Debt Actually Looks Like
Technical debt in software is code that works today but is expensive to change tomorrow. The analytical equivalent is analysis that produces a number today but becomes untrustworthy, unmaintainable, or incomprehensible over time.
Common forms:
| Debt Type | What It Looks Like |
|---|---|
| Hardcoded thresholds | WHERE revenue > 1000 — why 1000? No one remembers. |
| Undocumented joins | A LEFT JOIN added “to fix a discrepancy” that now silently drops 12% of rows. |
| Copy-paste queries | The same 80-line CTEs duplicated across 14 dashboards with slight variations. |
| One-off scripts gone permanent | A Python file called temp_fix_june.py that runs in production every night. |
| Untested transformations | Business logic that’s never been validated against a known-good sample. |
| Tribal knowledge | The metric only makes sense if you know about the 2023 migration, and only two people do. |
Each of these is survivable in isolation. The accumulation is not.
A Representative Scenario
Consider a three-week effort that produces a clean dashboard, a model with confident outputs, and an executive report that gets cited in strategy documents. The visible output is solid. The underlying construction contains:
- A revenue join that assumes customer IDs are globally unique. Two upstream systems share the same ID space, so the assumption is wrong.
- A churn metric defined differently in three places and averaged across them.
- A forecasting model trained on pre-acquisition data that has since been relabeled.
- An ETL process written under deadline pressure that has never been tested against a schema change.
Then an upstream condition changes. A source table is renamed. A business definition is updated. A new market is added that breaks a geographic assumption. The output becomes incorrect, and because the underlying assumptions were never documented, nobody can determine why the numbers changed or where to look.
How Analytical Debt Accumulates
Analytical debt is not a discipline problem. It accumulates under deadline pressure, when the immediate objective is “get the number by Friday” rather than “build something that will remain correct in twelve months.”
The shortcuts are defensible in the moment:
-- TODO: figure out why these don't match, just LEFT JOIN for now
SELECT a.*, b.revenue
FROM customers a
LEFT JOIN orders b ON a.id = b.customer_id
# hardcoded fiscal year start — revisit later
FISCAL_YEAR_START = "2024-01-01"# not sure which metric the dashboard uses, using both and picking the closer one
churn_v1 = calculate_churn_v1(df)
churn_v2 = calculate_churn_v2(df)
reported_churn = min(churn_v1, churn_v2) # matches the slide deckEach of these is a deferred decision. Deferred decisions accumulate. When the person who deferred them leaves, the decisions become permanent.
The Cost Profile
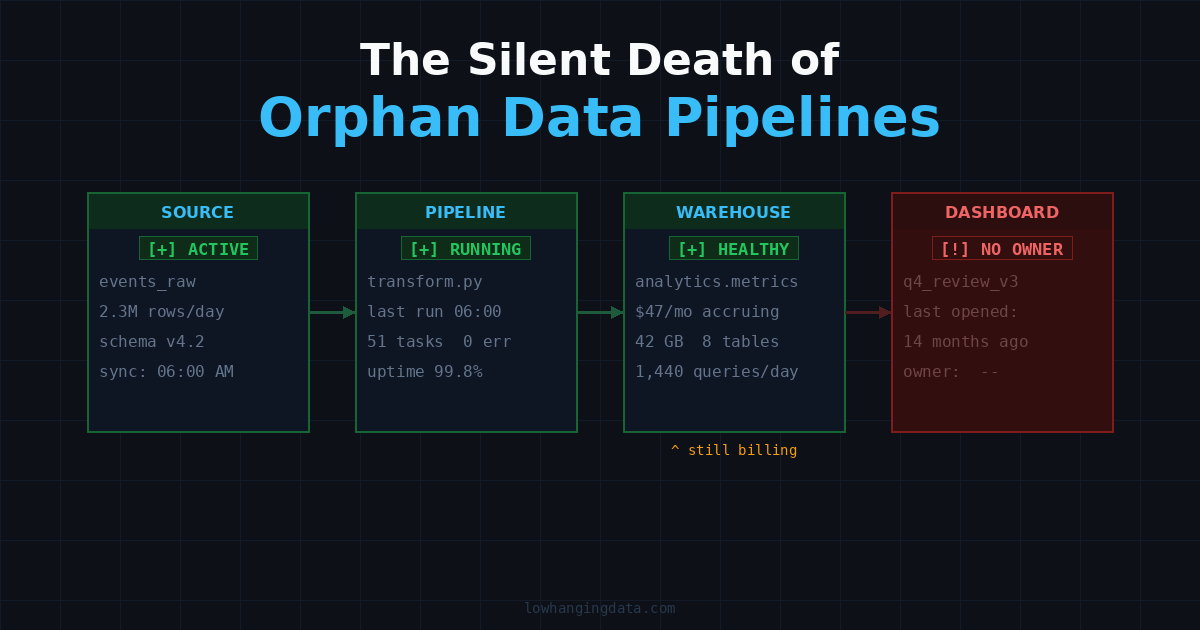
Software technical debt surfaces visibly: builds slow down, tests fail, bugs increase. Analytical debt hides better. The dashboard still loads. The report still runs. The number still looks plausible.
The cost surfaces in three ways:
1. Incorrect answers that go undetected. Silently incorrect metrics are the most damaging outcome. The business makes decisions based on numbers that do not reflect reality. This condition can persist for months.
2. Incorrect answers that eventually surface. The result is a credibility problem. “Why did the revenue number change?” is difficult to answer when the underlying answer is “the join was never fully understood.”
3. Inability to change the system safely. The most common symptom. The pipeline cannot be refactored because nobody knows what depends on it. A definition cannot be updated because it is hardcoded in eleven places. The system becomes read-only by default.
Paying Down Analytical Debt
The controls that manage software technical debt apply directly to analytics. None of this requires new tooling.
Test Your Transformations
If a transformation matters, write a test for it. Vitest, pytest, dbt tests, even a simple assertion — anything that fails loudly when the logic breaks.
def calculate_net_revenue(gross: float, refunds: float) -> float:
    """Net revenue after refunds. Refunds cannot exceed gross."""
    if refunds > gross:
        raise ValueError(f"Refunds ({refunds}) exceed gross revenue ({gross})")
    return gross - refunds
# test_revenue.py
def test_net_revenue_basic():
assert calculate_net_revenue(100.0, 20.0) == 80.0
def test_net_revenue_zero_refunds():
assert calculate_net_revenue(100.0, 0.0) == 100.0
def test_net_revenue_refunds_exceed_gross():
with pytest.raises(ValueError):
calculate_net_revenue(50.0, 75.0)An untested transformation is a promise with no accountability.
Document Assumptions Where They Live
Don’t put assumptions in a wiki that nobody reads. Put them in the code, next to the logic they describe:
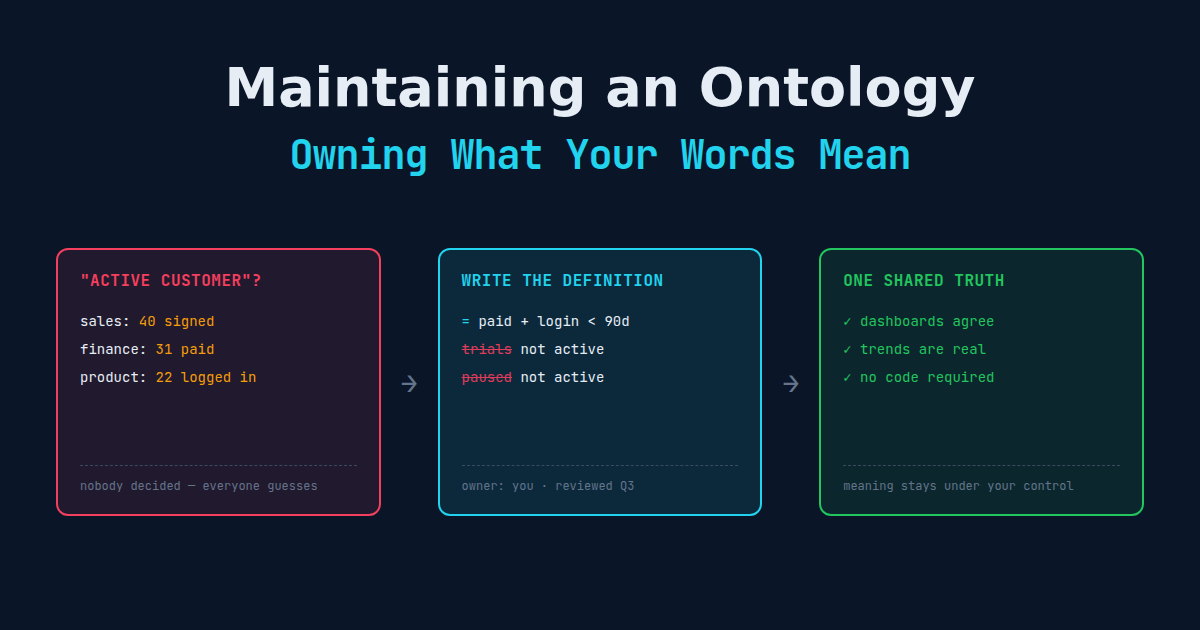
-- Active customers: defined as accounts with at least one transaction in the
-- trailing 90 days. Definition agreed with Finance on 2025-08-12.
-- See: https://internal/decisions/active-customer-definition
SELECT customer_id
FROM transactions
WHERE transaction_date >= CURRENT_DATE - INTERVAL '90 days'
GROUP BY customer_id
When the definition changes (and it will), the change happens in one place, with a comment trail.
Single Source of Truth for Metrics
If the same metric is calculated in multiple places, it will eventually diverge. Pick one canonical definition and reference it everywhere else.
-- metrics/churn_rate.sql
-- CANONICAL DEFINITION: do not recalculate inline elsewhere.
-- Churn = customers who had activity in prior 90 days but not current 90 days,
-- divided by total active customers in prior 90 days.
WITH prior_active AS (
    SELECT customer_id
    FROM transactions
    WHERE transaction_date BETWEEN CURRENT_DATE - INTERVAL '180 days'
                               AND CURRENT_DATE - INTERVAL '90 days'
    GROUP BY customer_id
),
current_active AS (
    SELECT customer_id
    FROM transactions
    WHERE transaction_date >= CURRENT_DATE - INTERVAL '90 days'
    GROUP BY customer_id
)
SELECT
    COUNT(p.customer_id) - COUNT(c.customer_id) AS churned,
    COUNT(p.customer_id) AS prior_active_count,
    ROUND(
        (COUNT(p.customer_id) - COUNT(c.customer_id))::NUMERIC
        / NULLIF(COUNT(p.customer_id), 0),
        4
    ) AS churn_rate
FROM prior_active p
LEFT JOIN current_active c USING (customer_id)
Version Control Everything
Queries, transformation scripts, pipeline configs — all of it should be in version control. A SQL file saved only in a BI tool’s “My Queries” folder is a liability.
analytics/
├── metrics/
│   ├── churn_rate.sql        # canonical definitions
│   ├── net_revenue.sql
│   └── active_customers.sql
├── pipelines/
│   ├── daily_summary.py
│   └── weekly_cohort.py
├── tests/
│   ├── test_revenue.py
│   └── test_churn.py
└── docs/
    └── metric-definitions.md
Version control turns “who changed the churn query and when?” from a mystery into a two-second git log lookup.
Treat Schema Changes as Breaking Changes
Your upstream data sources will change. Plan for it. Build validation into your pipeline entry point so you find out immediately rather than three weeks later when a dashboard quietly starts returning nulls:
EXPECTED_COLUMNS = {"customer_id", "transaction_date", "amount", "status"}

def validate_schema(df: pd.DataFrame, source: str) -> None:
    actual = set(df.columns)
    missing = EXPECTED_COLUMNS - actual
    extra = actual - EXPECTED_COLUMNS
    if missing:
        raise RuntimeError(f"{source}: missing expected columns: {missing}")
    if extra:
        print(f"WARNING — {source}: unexpected columns (may be fine): {extra}")
A loud failure on day one beats a silent wrong answer on day thirty.
The Minimum Standard
Before shipping any analysis, four questions should be answerable:
- Can every number in the output be explained? Not just the headline figure — every row, every filter, every join.
- If the analyst left tomorrow, could someone else maintain the work? Using existing documentation, not through reverse-engineering.
- If upstream data changes, will the change be detected? Is there a test or validation that would fail visibly?
- Is the business logic defined once, or duplicated across multiple places where it will drift?
These are not demanding standards. They are the minimum for analysis that drives real business decisions.
The Underlying Risk
The output of analysis is trust. Stakeholders trust the numbers, make decisions based on them, and hold the analyst accountable for the results. That trust is fragile: a single unexplained discrepancy, a dashboard that contradicts another, or a metric that changes definition silently takes months to recover from.
Analytical technical debt is not a code quality problem. It is a trust problem. And trust, once lost to a “weird number,” is expensive to rebuild.
Document assumptions where they live. Test what drives decisions. Version-control everything. Validate schema changes at the entry point. The output remains the same — the system survives the upstream changes that would otherwise break it.
Related Articles
- Building Your First Data Pipeline — Learn how to structure a pipeline so there is less surface area for analytical debt to accumulate.
- Data Cleaning and Validation — Testing transformations and validating assumptions before data reaches downstream analysis.
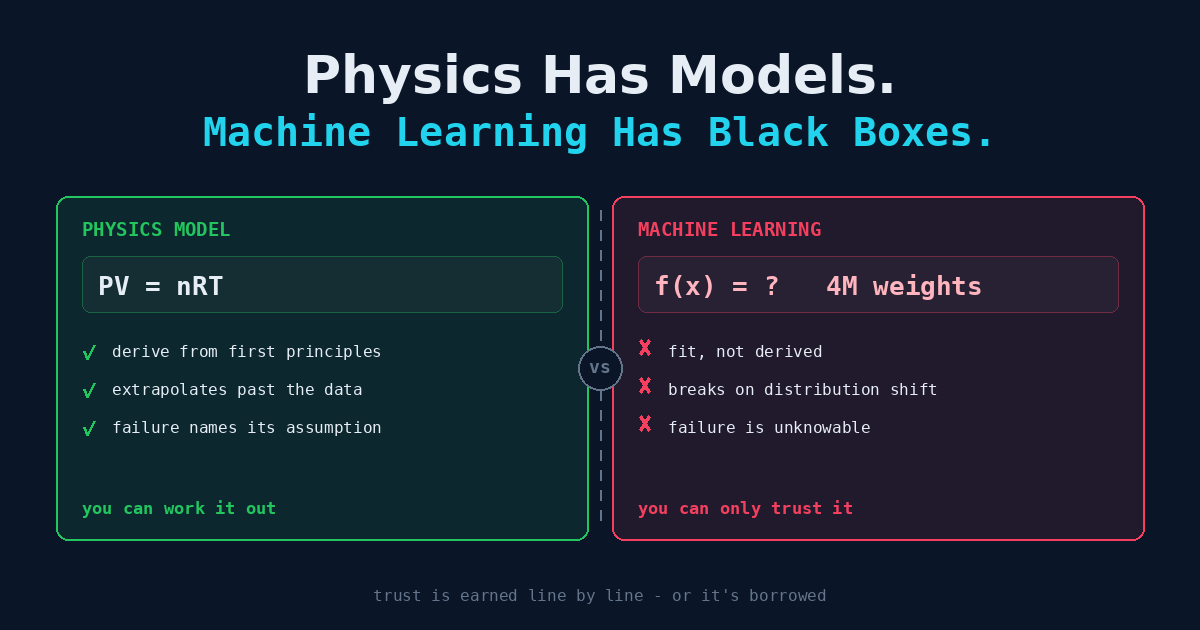
- Fear the Black Box: Why Data Must Be Understood End to End — The other side of analytical debt: accepting components you do not understand as ground truth.