Contents
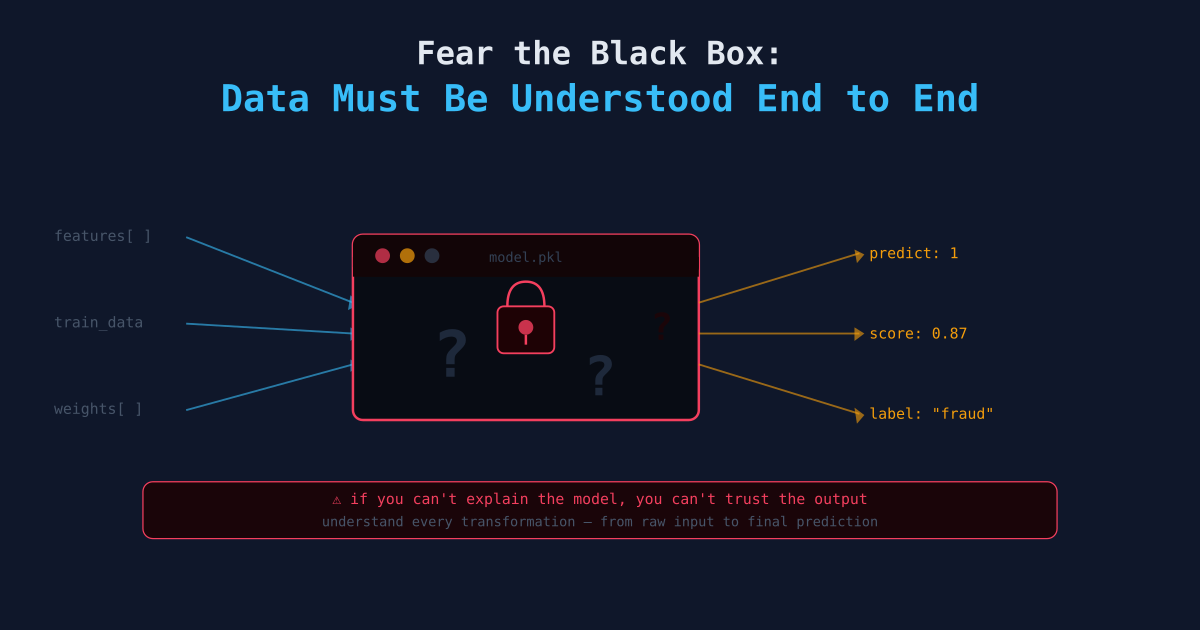
Fear the Black Box: Why Data Must Be Understood End to End
🌳 High Hanging Fruit
A common practice in data work is to treat sophisticated components as reliable without verifying how they operate: the model returns a score, the pipeline returns a number, the dashboard displays a metric, and downstream analysis proceeds on the assumption that each component is doing what it is expected to do. Verification does not happen.
This works until it does not. When the output becomes incorrect, the failure point is opaque — because the abstraction was accepted without understanding what was abstracted.
A black box in a data stack is not a neutral simplification. It is a component whose behavior cannot be interrogated when the output becomes suspect.
What a Black Box Actually Is
A black box is any component in your data stack that you treat as a given — an input, a process, or an output that you use but do not understand well enough to interrogate.
The form varies:
| Black Box Type | What It Looks Like |
|---|---|
| Undocumented metric | A KPI that appears on the executive dashboard but whose calculation nobody can reproduce from scratch |
| Inherited pipeline | An ETL process that “has always worked” but nobody has read the code for in two years |
| Third-party model score | A vendor-supplied propensity score used in targeting with no visibility into how it is generated |
| Tribal knowledge join | A LEFT JOIN added by someone who left the company to fix a discrepancy nobody understood |
| Opaque ML model | A gradient boosting model in production whose feature importances were documented once and never revisited |
| Assumed-clean source data | Raw data from an upstream system that is used without validation because it has “always been fine” |
What all of these share is that they are trusted without being understood. They are load-bearing walls with no blueprints.
Why Black Boxes Get Adopted
Black boxes do not feel dangerous at the point of adoption. They feel efficient.
The system is inherited. The numbers are in the expected range. Stakeholders are not raising concerns. There is a deadline. Reverse-engineering the existing pipeline is a week of work that is difficult to prioritize against new features, new models, and new dashboards.
The abstraction gets accepted. The output is treated as ground truth. Work proceeds.
For a period, the system continues to produce plausible outputs. Downstream analysis holds together. Dashboards refresh. Model scores continue to flow.
The failure surfaces later:
- A stakeholder asks for an explanation of why a score changed; no answer is available.
- The source system modifies a schema and the pipeline starts producing nulls.
- Two analyses using the same metric return different numbers and the gap cannot be explained.
- A new analyst asks where a number comes from and no one can answer definitively.
- The model begins producing systematically incorrect predictions and the feature responsible cannot be identified.
At that point the failure is compound: a data problem plus a credibility problem. The combination is a direct consequence of accepting the black box without understanding it.
The Failure Mode for Inference
The specific failure mode a black box creates: inferences are only as reliable as the understanding of the data they are built on.
Without end-to-end understanding of the data, inferences carry hidden assumptions. Those assumptions hold while nothing upstream changes and the analysis stays within the regime the data was generated in. When either condition breaks, the inferences break with them — and the failure is not traceable.
A typical scenario:
Source System → ETL Pipeline → Aggregated Table → Dashboard Metric → Business DecisionWhen only the last two steps — the dashboard and the decision — are understood, the analysis is entirely dependent on the correctness of everything upstream. The work is not analysis of data; it is analysis of the output of a system the analyst cannot inspect.
Inferences that collapse under scrutiny:
- “Conversion rate is improving” — but the tracking change three months ago altered how conversions are counted, and no one verified the effect.
- “This customer segment is high value” — but the segment definition uses a revenue metric that double-counts multi-product accounts.
- “Model accuracy held steady” — but the validation set was sampled before a product change that altered user behavior.
- “Churn is down” — but the churn definition was silently updated to exclude users who downgraded rather than cancelled.
Each of these appears to be a clean insight until it is traced back through the pipeline. Without traceability, the conclusion is defensible until someone examines the underlying measurement — at which point the inference fails publicly.
Top-Down Accountability: Tracing Every Number to Its Source
The discipline that prevents this failure is simple to state and costly to maintain: every number in an analysis must be traceable, end to end, to a source the analyst understands.
Top-down accountability means the following questions are answerable for any metric that is published or acted on:
- Where does this number come from at the row level?
- What transformations were applied between source and output?
- What assumptions are baked into those transformations?
- When did those assumptions last get validated?
- If the upstream data changes, how would I know?
This is not primarily a documentation exercise. It is a verification practice. An analyst who cannot answer these questions is familiar with the metric rather than in a position to defend it.
The practical implementation looks like tracing the DAG of your data — the directed acyclic graph from raw source to published output:
Raw transactions
  └─ cleaned_transactions (NULL handling, dedup logic — documented)
       └─ daily_revenue (aggregation rules — documented)
            └─ net_revenue (refund netting logic — documented, tested)
                 └─ dashboard_revenue_metric (date range, exclusion logic — documented)
Every node in the graph must be explainable. If any node is opaque — “the behavior of the cleaning step is not fully characterized” — then everything downstream of it inherits that uncertainty.
End-to-End Visibility in Practice
End-to-end visibility is not about producing exhaustive documentation. It is about building systems where the logic is readable, the assumptions are explicit, and the failure modes surface visibly.
Read the pipeline the analysis depends on
When a pipeline produces data used in an analysis, read it. Read, not skim — understand every transformation, every join condition, every filter. Run it against a sample. Verify that the actual output matches the expected behavior.
This is not a one-time task. Pipelines change. The appropriate practice is to re-read or review the diff of any pipeline on which the analysis depends whenever it is modified.
Make assumptions explicit in the code
Assumptions buried in someone’s head are invisible. Assumptions written as comments or assertions are at least findable:
-- Revenue here is gross revenue before refunds.
-- Refunds are handled downstream in net_revenue.sql.
-- Do NOT use this table for net revenue reporting.
SELECT
    order_date,
    SUM(order_amount) AS gross_revenue
FROM orders
WHERE status != 'cancelled'  -- cancelled orders excluded per Finance definition (2025-11-03)
GROUP BY order_date
# Assumption: customer_id is globally unique across all markets.
# Validated against the source system on 2026-01-15.
# If new markets are added, re-validate before using this join.
merged = customers.merge(orders, on='customer_id', how='left')
assert merged['customer_id'].is_unique or True # Log warning if this failsThe comment is not for posterity. It is for the next engineer to touch the code — often the original author, six months after the context has been lost.
Test the assumptions the inference depends on
When an inference depends on an assumption, test the assumption. Not once — on a schedule, or as part of every pipeline run.
def validate_revenue_pipeline(df):
    # No negative revenue before refund netting
    assert (df['gross_revenue'] >= 0).all(), "Negative gross revenue detected"

    # No missing dates in the output
    expected_dates = pd.date_range(df['order_date'].min(), df['order_date'].max())
    actual_dates = pd.to_datetime(df['order_date']).unique()
    missing = set(expected_dates.date) - set(actual_dates)
    if missing:
        raise ValueError(f"Missing dates in revenue pipeline output: {missing}")

    # Revenue should not spike or drop more than 50% week over week
    weekly = df.resample('W', on='order_date')['gross_revenue'].sum()
    pct_change = weekly.pct_change().abs()
    if (pct_change > 0.5).any():
        print(f"WARNING: Large week-over-week revenue swing detected. Review before publishing.")
A passing test is confirmed knowledge. A failing test is useful information. Either is preferable to no test at all.
Own the source, not just the output
The most demanding version of this principle is taking responsibility for the data upstream of the pipeline — not only cleaning it, but understanding what generates it.
For user behavior analysis, this means understanding the tracking implementation: which events fire under which conditions, which edge cases exist, whether SDK version affects collection, and what changed in recent deployments.
For financial analysis, this means understanding the accounting conventions: what constitutes gross versus net revenue, how fiscal year boundaries affect January numbers, whether refunds are backdated.
This is the discipline that separates analysis from reasoning backward from a visible output. Analysis understands the generative process forward and can reason about what the output means.
The Specific Failure of Opaque Models
Machine learning adds a specific dimension to this problem that warrants its own treatment.
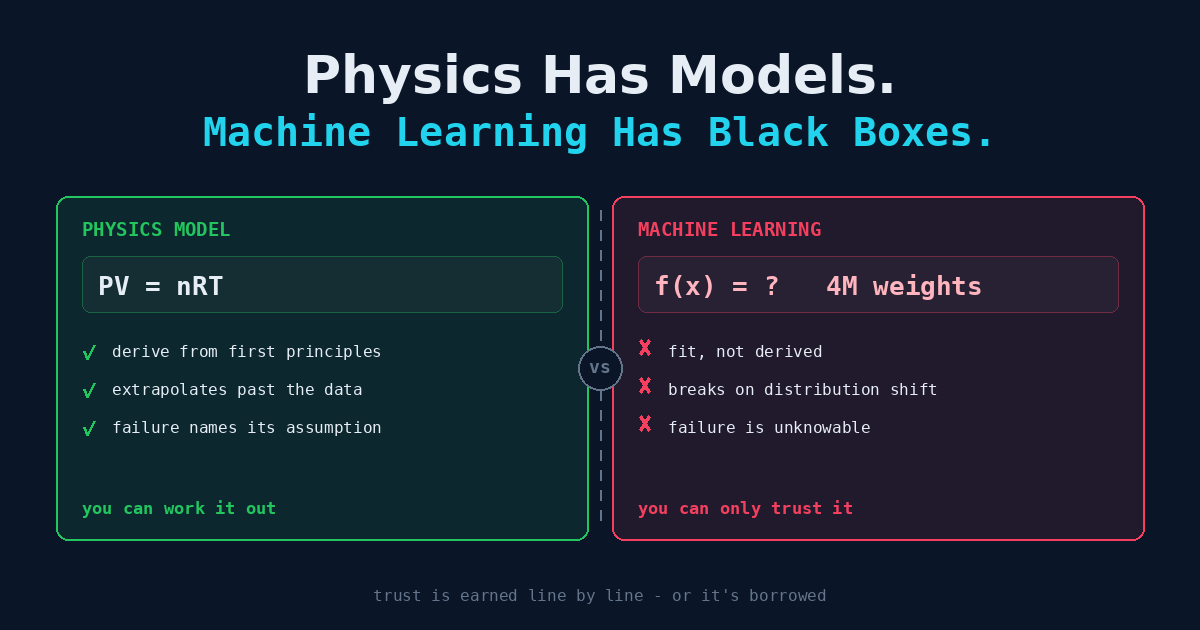
A model trained on historical data carries all the assumptions of that data. Deploying it and treating the outputs as ground truth without understanding feature construction, training window, label definition, or evaluation methodology is accepting a black box at a particularly consequential point in the pipeline.
The failure mode is distribution shift — the gradual or sudden divergence between the data the model was trained on and the data it is currently scoring. Without the understanding required to detect this, predictions can be incorrect for months before the problem surfaces.
The minimum standard for deploying a model in production:
□ Feature construction can be reproduced from raw data
□ The training window is known, along with the rationale for its selection
□ Labels are defined, validated, and documented
□ Evaluation methodology is known, along with what it does not measure
□ A monitoring process is in place that would surface drift or degraded performance
□ The model's behavior can be explained at an intuitive level, even if not mathematically
If those criteria are not met, the model is a black box. The practice is not using a model; it is trusting one.
The Standard
The concern about black boxes is not paranoia. It is the minimum standard for analytical accountability.
An analyst makes claims about what the data shows. Stakeholders make decisions based on those claims. When the claims are downstream of processes the analyst does not understand, the chain of trust contains a gap. The gap holds until an upstream change exposes it — and the resulting failure is attributed to the analysis, not to the undocumented assumption upstream.
The standard is not perfect understanding of every upstream system. The standard is traceability: any number in the output must be traceable back to its source, with each transformation identifiable and each underlying assumption explicit.
Without traceability, a number cannot be defended. And the analyst will be asked to defend it.
The Low Hanging Fruit
Select one metric that is published regularly — a dashboard KPI, a model output, a weekly report number — and trace it end to end. Not from memory. Find the pipeline, read the code, and identify every transformation, join, and filter between source and output.
Document every assumption that is not already explicit in the code. In most cases there will be at least three. Record them where the code lives.
Then determine: if an upstream system changed silently, would the change be detected? If not, implement a validation that would surface it.
Running this exercise once typically reveals a meaningful gap between the analyst’s model of the pipeline and the pipeline’s actual behavior. That gap is the case for end-to-end visibility. The black box appears safe because its behavior is not visible. That is precisely the reason it is not.
Related Articles
- Don’t Build Analytical Castles on Sand — The other face of the same problem: how undocumented assumptions and untested transforms become compounding liabilities.
- Data Cleaning and Validation — Practical techniques for building validation into pipelines so failures surface visibly rather than silently.
- Building Your First Data Pipeline — Understanding the pipeline you depend on starts with knowing how to build one end to end.