Contents
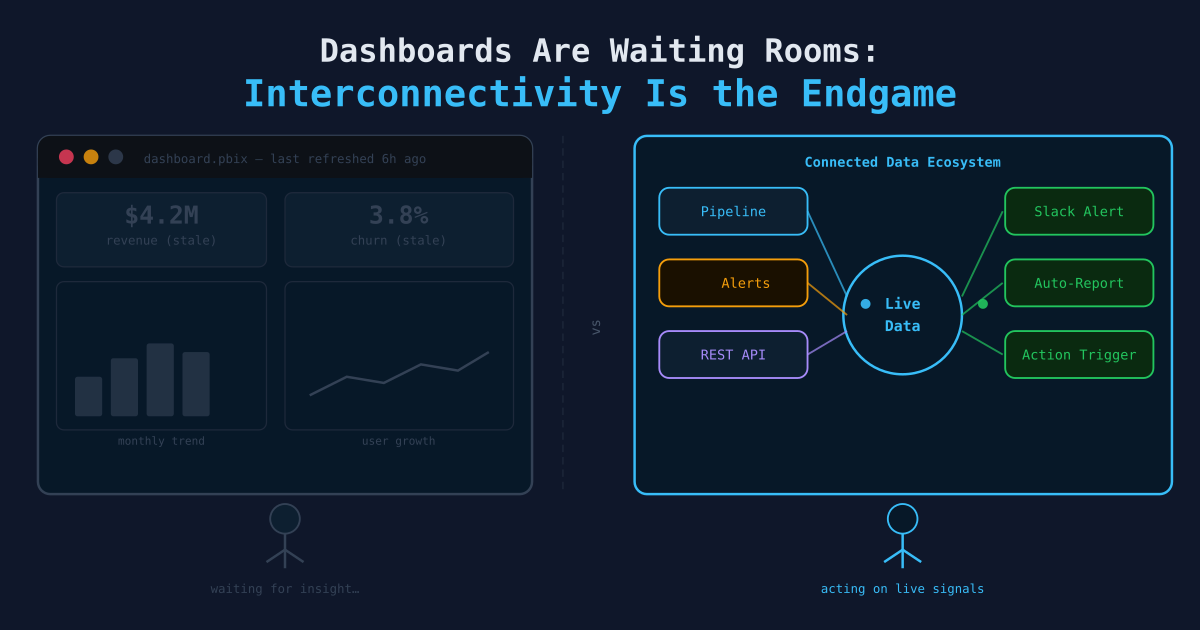
Dashboards Are Waiting Rooms: Interconnectivity Is the Endgame
🌳 High Hanging Fruit
There is a moment every data team eventually reaches. The pipeline is clean. The metrics are well-defined. The dashboards are beautiful. The stakeholders have been trained. The reporting cadence is locked in. And then someone in leadership says: “Great — now what does this actually do for us?”
It is an uncomfortable question. Because the honest answer, for most teams at that stage, is: it informs people who then do things.
That is not a data product. That is a waiting room.
The Anatomy of a Dashboard
A dashboard is a communication device. It takes data that has already happened, renders it into a visual form, and presents it to a human being who then decides what — if anything — to do about it.
Map out the full lifecycle:
Event occurs
  → Data is captured
    → Pipeline processes it
      → Warehouse stores it
        → Dashboard queries it
          → Human reviews it
            → Human decides to act
              → Human executes action
                → Action affects the system
Count the steps. Eight. The dashboard occupies step five. Everything after it — the decision, the execution, the effect — requires a human being to do something on the basis of what they saw.
Every one of those human steps is latency. Every one is a potential point of failure. Every one is a cost that does not scale.
Time Is Money, and Dashboards Consume Both
Consider what it actually costs to act on a dashboard.
Someone built it: that took time. Someone maintains it: that takes ongoing time. A meeting was scheduled to review it: that took calendar time for every attendee. Someone looked at a number, formed a conclusion, wrote an email or a Slack message, and waited for a response: that is hours, not seconds.
The number on the dashboard may represent a problem that needed to be addressed six hours ago. But six hours ago, the pipeline was still running, the dashboard was not open, and nobody was looking. The problem aged in a queue while the reporting cycle caught up.
| Stage | Human Required? | Time Cost |
|---|---|---|
| Event occurs | No | — |
| Data captured | No (ideally) | Seconds |
| Pipeline processes | No (ideally) | Minutes |
| Warehouse stores | No | Seconds |
| Dashboard queries | No | Seconds |
| Human reviews | Yes | Hours to days |
| Human decides | Yes | Minutes to hours |
| Human executes | Yes | Hours to days |
The bottleneck is not the data. The bottleneck is the handoff to a human being in the middle of an otherwise automated chain.
What Interconnectivity Actually Means
Interconnectivity is not a buzzword for adding more integrations to your data stack. It is a design philosophy that asks a different question than most data teams ask.
Most teams ask: How do we show stakeholders what is happening?
The interconnected team asks: How do we make the system respond to what is happening, without requiring a human in the loop?
The difference is not subtle. It is the difference between a smoke alarm that displays the temperature on a dashboard and a smoke alarm that calls the fire department.
A truly interconnected data system:
- Detects a condition
- Evaluates it against a defined threshold or rule
- Triggers an action automatically
- Logs what it did and why
- Alerts a human only when escalation is required
The human is not removed from the system. They are repositioned. Instead of being the processing unit that converts dashboards into actions, they become the governance layer that defines the rules and reviews the exceptions.
The Dashboard Is Not Wrong — It Is Immature
Dashboards are not bad. They are the right tool at the right stage of data maturity. When you are still figuring out what the metrics are, what the thresholds should be, and what actions are worth taking in response to what signals, a dashboard is exactly correct. You need human judgment in the loop because you have not yet codified what good judgment looks like.
The problem is when organizations treat the dashboard as the destination rather than the scaffolding.
The scaffolding phase looks like this:
Q1: Build the dashboard. Watch the metric. Form opinions about what
    the right response to different values should be.

Q2: Document those responses. If churn_rate > 0.05 this week,
    the team reviews retention offers. If inventory_days < 14,
    procurement gets notified. Write down the playbook that
    currently lives in people's heads.

Q3: Automate the playbook. If churn_rate > 0.05, trigger the
    retention workflow automatically. Alert the team to the
    exception, not to the monitoring task.

Q4: The dashboard becomes an audit log, not a daily ritual.
Most teams stop at Q1. They build the dashboard, declare success, and move on to the next dashboard request. The playbook never gets written. The automation never gets built. The human review never gets eliminated.
And so the team grows. And the reporting load grows. And the meeting count grows. And at some point there are fifteen people whose primary job is to look at things and decide what other people should do — and the organization wonders why data is expensive.
The Real Cost of Dashboard-Driven Operations
Here is a rough accounting of what a single manually reviewed dashboard costs over a year, assuming it drives a meaningful operational decision weekly:
- Build time: 20–40 hours (engineering, design, stakeholder alignment)
- Maintenance time: 1–3 hours/week (schema changes, broken queries, metric drift)
- Review time: 30–60 minutes/week per stakeholder, across however many stakeholders are in the room
- Decision latency: The time between the threshold being crossed and the action being taken — typically 24–72 hours in a meeting-driven organization
- Escalation cost: Every exception that falls outside the normal pattern requires a human to triage it
Scale that across twenty dashboards, four teams, two business units. You have built an organization whose primary data activity is humans watching numbers and telling other humans what to do about them.
That is not leverage. That is overhead.
What Gets Built Instead
The path from dashboard-driven to interconnected does not require replacing dashboards with AI. It requires replacing dashboards with rules — and then automating the execution of those rules.
The tools already exist:
Alerting systems replace the daily check-in. Instead of opening a dashboard every morning to see if inventory dropped below threshold, a system checks it continuously and notifies the relevant party the moment it does. The human acts on a specific condition, not on the general act of reviewing data.
Workflow triggers replace the human handoff. If a condition is true, a task gets created, a message gets sent, a process gets kicked off — automatically, without requiring anyone to convert a dashboard insight into an action. Zapier, n8n, Airflow, or a simple webhook — the mechanism is less important than the principle.
Feedback loops replace the reporting cycle. Instead of measuring what happened last week and reviewing it on Friday, the system measures outcomes continuously and adjusts parameters based on defined rules. Price optimization, inventory replenishment, churn intervention — these do not need a weekly review if the rules are right.
Exception dashboards replace monitoring dashboards. Instead of showing everything all the time, the dashboard shows only what fell outside the expected range and requires a human judgment call. The routine is handled. The anomaly is escalated.
The goal is not to eliminate dashboards. The goal is to eliminate the ones that exist only because nobody ever automated what they were supposed to trigger.
The Objection Worth Taking Seriously
The standard pushback: “But humans need to understand what’s happening in the business. Dashboards provide that understanding.”
This is true, and it is important. Domain comprehension matters. Strategic situational awareness matters. The kind of broad, intuition-building review that comes from looking at a business’s metrics over time is genuinely valuable and should not be automated away.
But there is a difference between a dashboard that builds strategic understanding and a dashboard that exists to tell someone to do a specific thing. The former is a legitimate use of a human’s attention. The latter is a process waiting to be automated.
If you can answer “yes” to all three of these questions, the dashboard is probably waste:
- Does this dashboard exist primarily to trigger a specific action when a specific condition is met?
- Is that action well-defined and repeatable?
- Has the team been taking that same action consistently for more than one quarter?
If the action is well-understood and consistent, the human review step is no longer adding judgment. It is adding latency.
The Organizational Implication
The mature data organization is not the one with the most dashboards. It is the one that has converted the most dashboards into systems.
That conversion requires a different kind of ambition than most data teams are measured against. Dashboard count is visible. Pipeline runs are visible. Automated interventions are invisible — they just work, silently, without a slide in the all-hands deck.
The incentive structure often works against interconnectivity because automation does not have a face. Nobody holds a review meeting for a workflow that ran correctly. The work that eliminates the meeting gets less credit than the work that fills it.
This is a leadership problem as much as a technical one. Organizations that value outcomes over activity will build interconnected systems. Organizations that value reporting over results will keep building dashboards.
The Question to Ask About Every Dashboard
Before commissioning a new one, before maintaining an existing one, before scheduling the review meeting:
What would have to be true for this dashboard to become unnecessary?
The answer is almost always: define the rule, build the trigger, automate the response, escalate only the exception.
That path is harder than building another visualization. It requires knowing what the action should be before you look at the data. It requires writing down the playbook that currently lives in someone’s intuition. It requires trusting the system to execute and positioning the human as the override, not the operator.
But the organizations that do this work end up with a data function that multiplies capacity rather than consuming it. The ones that do not end up with a very large, very expensive waiting room.
Build the connections. The dashboard was never the destination.
Related Articles
- KPIs Are a Cultural Change, Not a Dashboard Project — Why the behavioral commitment behind metrics matters more than the dashboards that display them.
- The Gas Gauge Is the Hardest Chart to Build — How to move from tracking numbers to actually understanding what they mean and what to do about them.
- Scheduling and Automating Data Pipelines — The technical foundation for replacing manual dashboard reviews with automated triggers.