Contents
Excel to SQL: Low Hanging Fruit for Making the Switch
🍎 Low Hanging Fruit
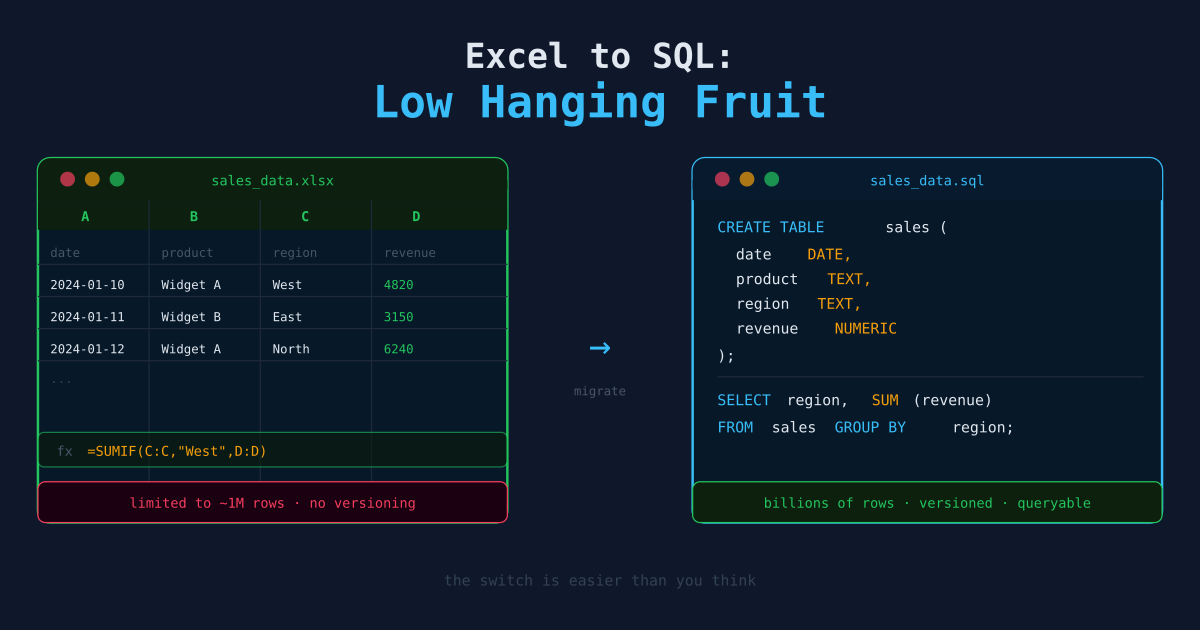
If you already know Excel well, SQL is easier to learn than most people expect. The concepts map almost directly — you’re just swapping formulas and pivot tables for queries. This article lays out the highest-value topics to tackle first: the ones that immediately replace the most painful parts of Excel work with something faster and more reliable.
Why Bother with SQL at All?
Excel is excellent for small datasets and ad-hoc exploration. SQL starts winning when:
- Your dataset is too large to open without Excel slowing down or crashing
- You need to combine data from multiple sheets or files reliably
- You want reproducible results — a query is repeatable; a manual filter is not
- You need to share logic with a team without emailing
.xlsxfiles
The good news: you don’t have to abandon Excel. The best move is learning SQL for the work where it fits, and keeping Excel for everything else.
Article 1: Replacing VLOOKUP with a JOIN
Why it’s low hanging fruit: VLOOKUP is the single most common reason Excel breaks down. It’s slow on large files, breaks when columns shift, and fails silently with #N/A. A SQL JOIN does the same job in two lines and handles millions of rows without complaint.
Topics to cover:
- The direct mental model:
VLOOKUP(id, table, col, FALSE)→JOIN table ON id = id INNER JOINvsLEFT JOIN— the equivalent of VLOOKUP’s#N/Abehavior vs. keeping all rows- Joining on multiple columns (something VLOOKUP can’t do at all)
- A side-by-side worked example: lookup a product name from a product table, once in Excel and once in SQL
Sample hook: Take a 50,000-row orders sheet with a product ID column. In Excel, adding product names requires a VLOOKUP across every row, and the file bogs down. In SQL, it’s a single JOIN that runs in under a second.
Article 2: Replacing Pivot Tables with GROUP BY
Why it’s low hanging fruit: Pivot tables are where most Excel users spend the most time clicking. GROUP BY does the same thing with text you can save, version, and re-run.
Topics to cover:
- The direct mapping: drag a field to “Rows” →
GROUP BY column; drag a value to “Values” →SUM(),COUNT(),AVG() HAVINGas the equivalent of filtering a pivot table after it’s built (vs.WHERE, which filters before)- Multi-level grouping: grouping by two or three columns at once
- Calculated fields: adding a derived column to a pivot table → a computed expression in
SELECT
Sample hook: Monthly revenue by region — a pivot table takes three minutes to configure and is hard to hand off. The equivalent SQL query is six lines and runs anywhere.
Article 3: Loading Your Excel File into DuckDB
Why it’s low hanging fruit: The biggest friction in adopting SQL is getting your data in. DuckDB removes this barrier almost entirely — it reads Excel files, CSVs, and Parquet files directly, with no database setup.
Topics to cover:
- Installing DuckDB (one
pip installcommand) - Reading an
.xlsxor.csvfile directly withread_csv_auto()or the Excel extension - Running your first
SELECTon the file — no import, no schema definition - When to graduate to SQLite (persistent storage, updates) vs. sticking with DuckDB (ad-hoc queries on files)
Sample hook: You have a folder of monthly sales exports as CSV files. With DuckDB you can SELECT * FROM read_csv_auto('sales_*.csv') and query all of them at once, in seconds.
Article 4: Filtering and Sorting — WHERE and ORDER BY
Why it’s low hanging fruit: Every Excel user knows how to apply a filter or sort a column. The SQL equivalents are the first two things you learn, and they work identically at any scale.
Topics to cover:
WHEREas the equivalent of Excel’s column filter- Comparison operators:
=,!=,>,<,BETWEEN,IN,LIKE - Combining conditions:
AND,OR,NOT— and when to use parentheses ORDER BYwithASC/DESC— the equivalent of sorting a columnLIMIT— the equivalent of showing only the top N rows
Sample hook: Filtering a customer list to active customers in a specific region who signed up in the last 90 days. In Excel: three separate filter dropdowns plus a date formula. In SQL: one WHERE clause.
Article 5: Cleaning Dirty Data with SQL
Why it’s low hanging fruit: Excel data is almost always messy — inconsistent casing, extra spaces, blank cells in numeric columns, duplicate rows. SQL has direct functions for all of these, and applying them once in a query is repeatable.
Topics to cover:
TRIM()for extra whitespace — the thing you normally do with Find & ReplaceUPPER()/LOWER()for normalizing inconsistent casingCOALESCE()to replace NULLs with a default value — the SQL version of=IF(ISBLANK(A1), 0, A1)- Deduplication with
SELECT DISTINCTandGROUP BY+HAVING COUNT(*) > 1 - Type casting: converting a column stored as text into a number or date
Sample hook: A survey export with 12,000 rows where the “State” column contains “CA”, “ca”, “California”, and ” CA ” all meaning the same thing. One UPPER(TRIM(state)) in your query fixes it everywhere at once.
Article 6: Building a Summary Table to Replace a Report
Why it’s low hanging fruit: Many Excel workbooks exist purely to produce a summary from raw data — a weekly report, a dashboard feed, a monthly rollup. A CREATE TABLE AS SELECT query replaces that entire workflow with something that runs in one command.
Topics to cover:
CREATE TABLE AS SELECT— write query results into a new table- Scheduling the query to run on a cadence (link to the automation article)
- Window functions as a step up: running totals, rank within a group — things that require complex Excel formulas
- Exporting the result back to CSV for stakeholders who still want Excel
Sample hook: A weekly revenue report that takes 45 minutes to assemble in Excel — pulling data from three sheets, adding formulas, formatting a pivot table. A 20-line SQL query produces the same output in three seconds.
Suggested Learning Order
If you’re starting from scratch, this order minimizes friction:
- Load your data — Article 3 (DuckDB setup)
- Filter and sort — Article 4 (WHERE / ORDER BY)
- Aggregate — Article 2 (GROUP BY)
- Combine tables — Article 1 (JOIN)
- Clean — Article 5 (string and NULL functions)
- Automate — Article 6 (CREATE TABLE AS SELECT)
Each step unlocks a specific category of work that was painful in Excel. You don’t need to learn all of SQL — just these six patterns cover the vast majority of everyday data work.
Next Steps
- Organizing Data with SQL — A practical reference for the queries you’ll use most.
- Working with Parquet and DuckDB — Go further with DuckDB for large-file analysis.
- Python & Pandas for Data Wrangling — When SQL isn’t quite enough and you need programmatic control.