Contents
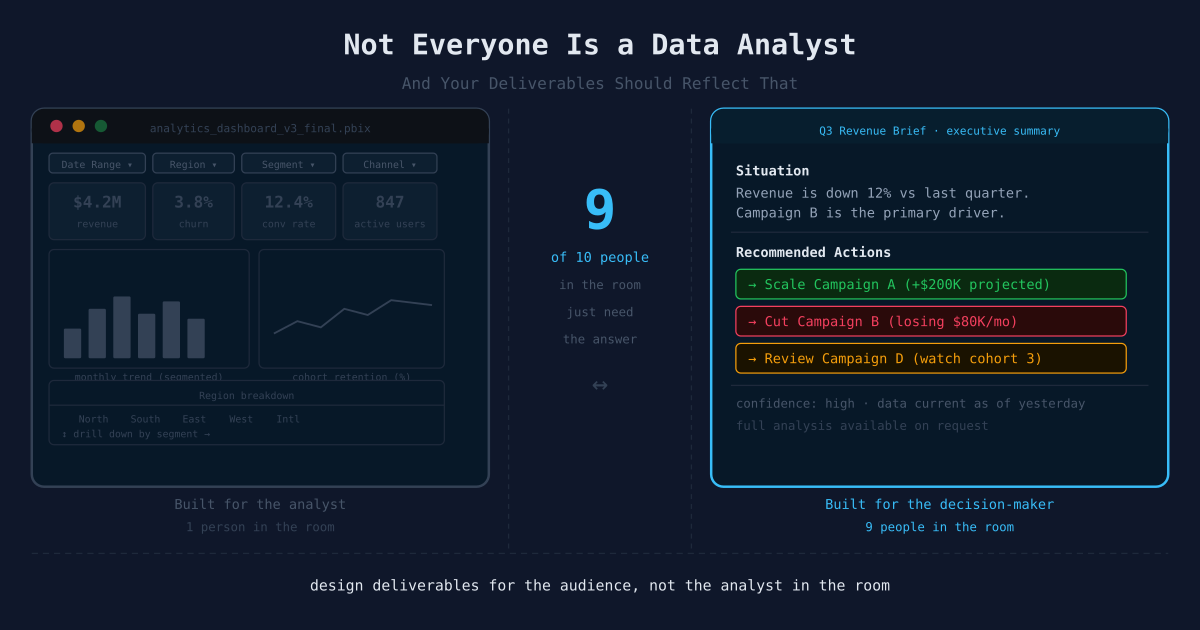
Not Everyone Is a Data Analyst (And Your Deliverables Should Reflect That)
🍎 Low Hanging Fruit
A common failure pattern emerges in mature data teams: the team surfaces interesting patterns, builds flexible dashboards with filters and drill-downs, and delivers outputs optimized for analytical exploration. Stakeholders receive the output, acknowledge it, and ask the only question that matters to them: “What should we do?”
This is a reasonable response from an audience that was not hired to perform data analysis.
The Audience Composition Is Not Analytical
Review the actual composition of the people who receive data deliverables in most organizations.
The executive allocating resources this week. The operations manager determining whether a process is working or broken. The marketing lead deciding which campaign to scale and which to cut. The product manager assessing whether a recently-shipped feature has produced measurable effect.
Only one of those stakeholders — at most — is a data analyst. The rest are domain experts who require information to make decisions. Their careers are built around operating the business, not exploring datasets.
The default data deliverable — an interactive dashboard, a pivot-table spreadsheet, a twenty-page findings report — is optimized for an analyst. It communicates: “Here are the raw materials. Determine what matters.” For non-analyst stakeholders, this shifts the analytical burden to the wrong audience.
Analyst response to exploratory data:
  → "Here is a rich dataset. Investigate the patterns."

Non-analyst response to exploratory data:
  → "Here is unresolved work. Produce a recommendation before the next meeting."
The underlying data is identical. The implied workload for the recipient is not.
The Difference Between Data and Intelligence
Data is what happened. Intelligence is what it means and what to do about it.
A spreadsheet showing monthly sales by region by product by channel by rep is data. “The Northeast is underperforming on enterprise deals, and the gap opened up in Q3 after the pricing change — recommend targeted discount authority for that segment” is intelligence.
The analyst’s function is to close the distance between those two outputs. Most data teams stop at data delivery and treat the output as complete — handing over the spreadsheet and waiting for follow-up questions. The exploration becomes the deliverable rather than the input to the deliverable.
The practice feels rigorous. The output is incomplete.
| What Was Delivered | What Was Needed | What Happens Next |
|---|---|---|
| Dashboard with 14 filters | One clear answer | Stakeholder guesses. Or asks for a meeting. |
| Report with every finding | The three that matter | Stakeholder reads two pages, loses the thread |
| Raw data export | Specific recommendation | Stakeholder ignores it or recreates your work badly |
| ”Here’s what the data shows" | "Here’s what to do” | Decision gets delayed or made without data |
The common thread: the more exploration you hand to a non-analyst, the less likely they are to use it correctly — and the more likely they are to either ignore it or form the wrong conclusion from it.
Why Data Teams Default to Exploration
The pattern is not driven by effort. It is typically one of three causes.
Uncertainty about the correct answer. When the analyst is not confident in what the data means, an exploratory deliverable defers the judgment. “I showed you everything. What you do with it is your call.” This protects the analyst from being wrong and transfers analytical work to a recipient less equipped to complete it.
Pressure to demonstrate effort. Analysts know how much work the analysis required. Showing the full dataset, breakdowns, and cross-tabs communicates that effort. A single recommendation appears thin in comparison, despite representing more judgment. The impulse is understandable; the result is deliverables that obscure the recommendation rather than surface it.
Intrinsic interest in the data. Analysts often find the data itself interesting and assume other stakeholders will. They will not. An operations manager does not want to study a cohort retention waterfall. They want to know whether retention is acceptable and, if not, what to do about it.
All three patterns produce the same outcome: a deliverable designed for an audience that is not in the room.
What Actionable Intelligence Looks Like
The test for an actionable deliverable is simple: can the recipient take action without requiring a follow-up question to determine what to do?
Some clarification questions are normal. The core question — what should I do? — must be answered by the deliverable itself.
This requires the analyst to make a judgment call and document it explicitly. Doing so exposes the analyst to being wrong. It also transfers ownership of the recommendation from the stakeholder back to the analyst, where it belongs. That accountability is the core function of the role.
Exploratory deliverable:
  "Here are the retention numbers broken down by cohort,
   acquisition channel, plan type, and region. The filters
   are at the top. Let me know if you have questions."

Actionable deliverable:
  "Retention is on track except for users acquired through
   paid social in Q4. That cohort churns at 2x the baseline
   rate by month three. Recommend pausing paid social
   acquisition until the onboarding flow for that segment
   is fixed — the problem appears to be activation, not fit."
The second deliverable takes a position, draws a conclusion, and recommends an action. The recipient can proceed without scheduling a meeting. The first deliverable generates meetings.
The Supporting Analysis Remains
The underlying data does not disappear. The exploration happened. The rigor is real. The cross-tabs exist. They belong in an appendix, not in the headline.
Producing analysis that business stakeholders act on requires collapsing the work into a usable form without losing the structural integrity underneath it. This is not a communication skill bolted onto an analytical skill. It is a core component of applied analysis.
The medical profession provides a useful parallel. A physician runs tests, reviews results, synthesizes a diagnosis, and delivers a recommendation. They do not hand the patient a lab printout and defer interpretation. The judgment call is their output. That accountability is what makes the recommendation trustworthy.
Data analysts in organizational contexts are in the same position. Recipients are not equipped to synthesize the underlying data. The synthesis is the analyst’s product.
Designing Deliverables for the Actual Audience
In practice, this requires a different set of framing questions before producing any deliverable.
Before asking “What does the data show?” — ask “What decision needs to be made, and by whom?”
Before building a dashboard — ask “What would make this dashboard unnecessary? Can the question be answered directly?”
Before writing a findings section — ask “What is the single thing the reader needs to walk away knowing? Is it stated in the first paragraph?”
Before adding another chart — ask “Does this chart change what the stakeholder should do, or does it only display more information?”
Most analytical work can be collapsed into a simpler form than it is typically delivered in. The reason it is not comes down to one of two causes: the analyst has not finished the synthesis, or the analyst has not been trained to treat the deliverable as something that must drive a decision rather than inform general understanding. Both are addressable.
The Low Hanging Fruit
Before building the dashboard or writing the report for any completed analysis, produce one sentence in the following form: “Based on this analysis, [stakeholder] should [specific action] because [key finding].”
If the sentence cannot be written, the analysis is not yet complete.
If the sentence can be written, that sentence is the deliverable. Everything else is the appendix.
The audience for most data work is not a room of practitioners who want to explore data. It is a room of stakeholders who need to make decisions. The analyst’s product is intelligence, not exploration. Exploration is the process.
The distance between those two outputs is the distance between a data team that is ignored and one whose recommendations get acted on.
Related Articles
- Write for the Executive. Survive the Analyst. — The structural discipline of building analysis that works for both fast executive decisions and deep analyst review.
- The Gas Gauge Is the Hardest Chart to Build — A concrete example of what “actionable intelligence” looks like in visualization form.
- Dashboards Are Waiting Rooms: Interconnectivity Is the Endgame — Where dashboard design leads when the goal shifts from informing humans to replacing manual handoffs.