Contents
Operational Telemetry, Explained for the Person Reading the Dashboard
🍎 Low Hanging Fruit
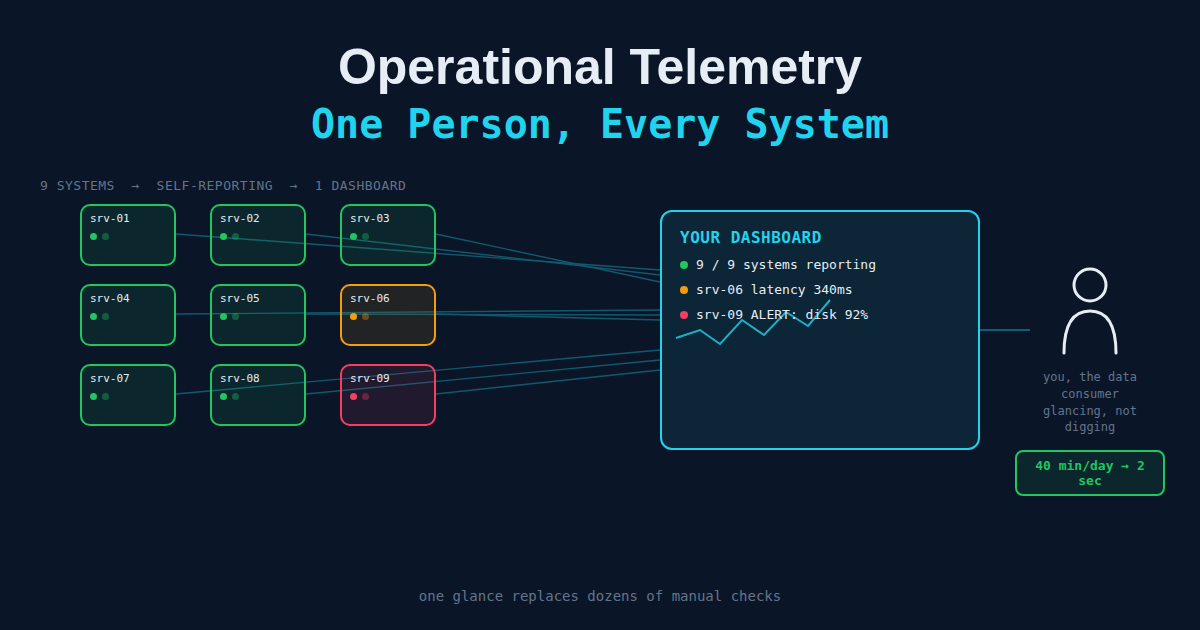
You open a dashboard, glance at a row of green dots, and move on with your day. That two-second glance is the entire point of operational telemetry — and it’s worth understanding what’s happening behind it, because it’s the reason you’re not spending your morning pinging engineers or refreshing a status page and hoping.
“Telemetry” sounds like rocket science — and honestly, it started out as exactly that. NASA used it to know what was happening inside a spacecraft without being inside the spacecraft. The same basic idea now runs quietly behind almost every dashboard, status page, and Slack alert you rely on. This article explains what it is, in plain terms, from the point of view of the person consuming it rather than the person building it.
The One-Sentence Definition
Telemetry is data a system sends about itself, automatically, so a human doesn’t have to go ask.
That’s it. No AI, no magic — just a program that periodically reports “here’s how I’m doing” to somewhere a person can see it later. You, sitting on the receiving end, get the distilled version — a dashboard, a status badge, an alert — instead of raw logs, code, or a server you’d have to log into yourself.
Operational telemetry is telemetry specifically about the health and behavior of running systems: is the service up? Is it slow? Are requests failing? It’s the difference between what the business is doing (sales, signups, revenue — that’s analytics you consume for decisions) and whether the machinery behind it is running correctly (that’s operations you consume for reassurance, or for a heads-up).
The Analogy That Actually Sticks
Think about a car dashboard. As the driver, you don’t pop the hood at every red light to check the engine temperature, oil level, and battery voltage by hand. Sensors do that continuously and report the results to a small panel in front of you. Most of the time you glance at it for half a second and move on. Occasionally a warning light turns red, and that’s your signal to actually pay attention. You never had to learn how the sensor works — you just needed to trust that the light tells the truth.
Operational telemetry is that dashboard, but for the services, apps, and pipelines you depend on instead of a car engine.
Or think of a hospital. One nurse can watch over a dozen patients at once because each bed has a monitor silently tracking heart rate, oxygen, and blood pressure — and it alarms the instant something crosses a dangerous threshold. The nurse isn’t the one measuring blood pressure by hand every five minutes; the nurse is consuming a summary the monitor produces, and only steps in when the summary says something’s wrong.
That’s the whole point of this article: telemetry is what lets one person — you — effectively keep watch over far more systems than you could ever check by hand, because a machine already did the checking and handed you the summary.
What’s Actually Behind the Dashboard You Look At
You’ll rarely see this next part directly — it’s built by whoever maintains the system — but it helps to know what’s feeding the numbers you’re glancing at:
1. Metrics — numbers over time
A metric is a single number, tracked over time. CPU usage. Requests per second. Number of errors in the last minute. This is almost always what a dashboard is showing you: a line going up, a percentage, a status dot. Cheap to graph, great for spotting trends at a glance.
2. Logs — the diary of events
A log is a timestamped line of text describing something that happened. 2026-07-14 09:03:12 — payment failed for order #4471 — timeout connecting to bank API. You typically won’t see raw logs unless something’s already gone wrong and someone needs to dig in — a metric tells you that something is off; a log tells you what went wrong.
3. Traces — the story of one request
A trace follows a single request as it travels through a system — from a click, through an API, into a database, and back. As a consumer you’ll almost never look at one directly, but it’s how the person behind the dashboard answers “which one of these five services is actually the slow one?” instead of guessing.
Put together — metrics for “is something wrong,” logs for “what exactly went wrong,” traces for “where in the chain did it go wrong” — you get a system that reports on itself well enough that the only thing that ever reaches you is a clean, glanceable summary.
How a Raw Signal Becomes the Number You See
The flow is the same shape almost everywhere, even though the tool names differ:
1. INSTRUMENT  — code emits a metric, log line, or trace span
2. COLLECT     — an agent or library ships that data somewhere central
3. STORE       — a time-series database or log store holds onto it
4. VISUALIZE   — a dashboard turns raw numbers into something readable   ← what you actually see
5. ALERT       — a rule watches the data and pages a human when it crosses a line   ← or this
Steps 1 through 3 happen entirely behind the scenes. As a consumer, your entire relationship with telemetry is steps 4 and 5 — a chart you glance at, or a notification that lands in your inbox.
Here’s a tiny, concrete example of what’s running underneath a “system status: healthy” badge you might see on a page:
import requests
import time

def check_health(url):
    start = time.time()
    try:
        response = requests.get(url, timeout=5)
        latency_ms = (time.time() - start) * 1000
        return {
            "url": url,
            "status_code": response.status_code,
            "latency_ms": round(latency_ms, 1),
            "healthy": response.status_code == 200,
        }
    except requests.exceptions.RequestException as e:
        return {"url": url, "status_code": None, "latency_ms": None, "healthy": False, "error": str(e)}

result = check_health("https://lowhangingdata.com")
print(result)
Run that once every minute, store the output, and plot healthy over time — that single green/red dot is the entire output of the loop above, quietly running thousands of times so you never have to run it yourself.
Why This Is a Massive Force Multiplier — For You
Here’s the part that matters most, and it’s about your time, not the engineer’s.
Without telemetry, knowing if things are okay means you actively checking: messaging someone, refreshing a page, waiting for a status email, or just finding out the hard way when something breaks. That doesn’t scale. Ten systems you depend on means ten things to keep track of in your head. A hundred means you’ve effectively lost the ability to know, and you’re only ever reacting after the fact.
With telemetry, the checking happens automatically, continuously, for free — and it’s already been distilled down to the two seconds it takes you to glance at a dashboard. Your job shifts from “go find out if something’s wrong” to “notice when something taps you on the shoulder.” That’s the shift from a nurse checking one patient at a time to one nurse calmly watching twelve monitors, confident the monitors will speak up.
Put a number on it
Say you’re keeping tabs on 20 things you care about — pipelines, services, whatever feeds your reports. Manually checking each one — opening a tool, running a query, asking someone “is this still working?” — might take even a lean 2 minutes apiece. That’s roughly 40 minutes a day just to find out nothing’s wrong, before you’ve done any actual work with the results. Do that daily and it’s over 170 hours a year spent looking, not doing.
A dashboard fed by telemetry collapses that to the same two-second glance whether you’re watching 5 systems or 500 — the check time doesn’t scale with how much you’re responsible for, because a machine is doing the checking continuously in the background instead of you doing it in bursts. The 40 minutes doesn’t get faster, it gets deleted, and it’s replaced by the rare, well-timed alert that only interrupts you when something actually needs a human. That gap — hours of manual polling turned into seconds of glancing — is the entire economic case for telemetry.
This is why one person can reasonably keep an eye on the health of a fleet of systems, or a whole product’s worth of dependencies, without being an engineer themselves. The work of monitoring didn’t disappear — it just got moved off your plate and onto the dashboard, and the time it used to cost you got moved back into your day.
How to Read a Dashboard Like Someone Who Understands It
A few habits that make you a sharper consumer of telemetry, even with zero engineering background:
- A green dot means “within the expected range,” not “perfect.” Telemetry reports against thresholds someone set. It’s a useful signal, not a guarantee.
- Look at the trend, not just the snapshot. A metric climbing steadily for two hours is worth noticing even if it hasn’t crossed into “red” yet — you’re catching the story before the alert has to.
- One red dot among ten green ones is still worth ten seconds. That’s the whole system working as intended: it’s surfacing the one thing that needs a human, not burying it.
- Know the difference between “the business is fine” and “the system is fine.” Revenue can be up while the checkout service is quietly erroring for 2% of users. Operational telemetry and business metrics answer different questions — don’t assume one covers the other.
- A dashboard nobody looks at isn’t telemetry, it’s decoration. The value only exists the moment a human actually glances at it and can act faster because of what they saw.
The Takeaway
Operational telemetry is just a system reporting on its own health so that you, the person who needs the answer, don’t have to go dig for it yourself. Metrics tell you something’s wrong, logs tell you what, traces tell you where — but all of that machinery exists so that what actually reaches you is a clean dot on a dashboard or a single well-timed alert. That’s what lets one person genuinely keep watch over an entire fleet of systems: not by checking harder, but by trusting a summary someone else built to do the checking for them.
Next Steps
- Building Your First Data Pipeline — the same collect → store → visualize pattern, applied to business data instead of system health.
- Pulling Data from REST APIs — the request/response mechanics behind most health-check and telemetry-shipping code.
- KPIs Are a Cultural Change, Not a Dashboard Project — why a dashboard alone doesn’t fix anything until people actually act on what it shows.