Contents
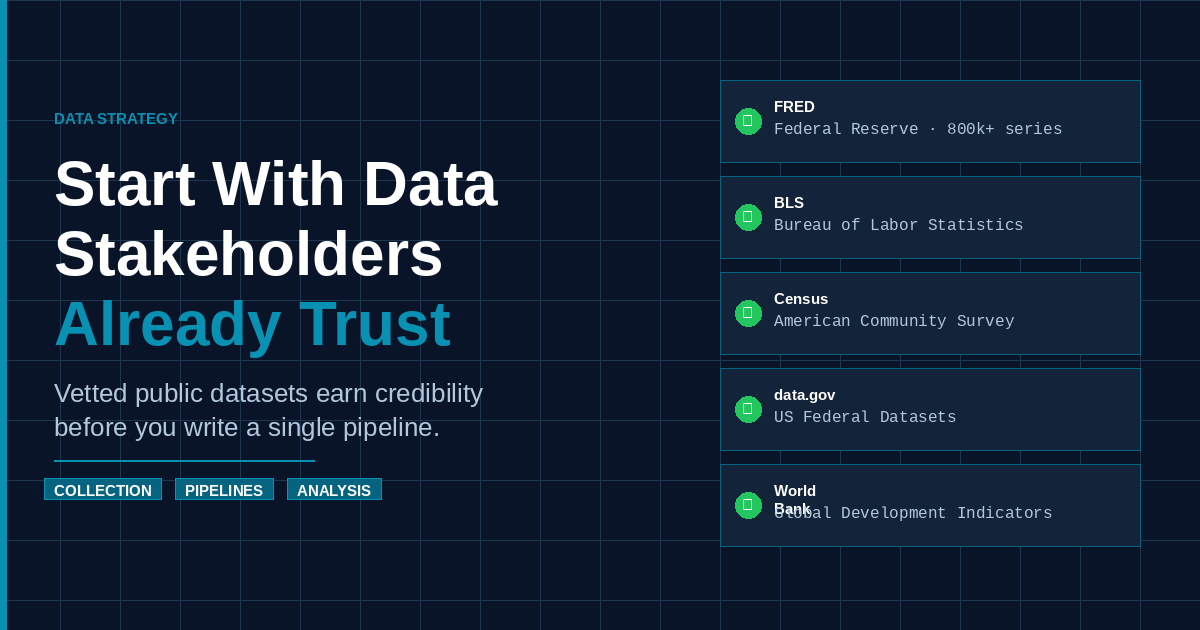
Start With Data Stakeholders Already Trust
🍎 Low Hanging Fruit
The first question every stakeholder asks about a new analytics output is not “what does this tell us?” It is “can I trust this?”
That question is reasonable. They have seen dashboards that were wrong. They have made decisions based on reports that contained bad data. They have watched confident analytical conclusions fail to hold up under scrutiny. Their skepticism is earned.
The analyst’s job, before any insight becomes actionable, is to earn that trust back. The fastest path is not building better methodology — it is starting with data the stakeholder already trusts independently of you.
Why Unfamiliar Data Stalls Adoption
When you bring analytics to a stakeholder for the first time, you are asking them to evaluate two things simultaneously: whether your analysis is correct, and whether the underlying data is reliable. They usually cannot do both at once.
If the data is proprietary or internal, they have no external reference point. They cannot check your numbers against anything they already know. The burden of proof lands entirely on your methodology, your presentation, and the trust they have in you — which, early in a working relationship, is low.
This is the adoption stall. The analysis is technically sound. The data is genuinely interesting. But because the stakeholder cannot independently verify either one, the output lands in a “we’ll revisit this” queue and does not move decisions.
Vetted public datasets solve this directly. If the underlying data is from a source the stakeholder already respects, the credibility of the data is no longer your problem to solve.
What Makes a Dataset “Trusted”
A trusted dataset has three properties: the source is known, the methodology is documented, and the output is verifiable by the stakeholder through other channels.
Government statistical agencies are the canonical example. The Bureau of Labor Statistics publishes monthly unemployment rates that appear in every major newspaper. GDP figures from the Bureau of Economic Analysis are cited in earnings calls. Census data shows up in business plans, grant applications, and policy briefs.
When you build analytics on this data, you are building on a foundation your stakeholder already believes. They may not know the BLS’s sampling methodology in detail, but they know the unemployment rate — they have encountered it every month for their entire career. That familiarity is your credibility transfer.
Other reliable starting points:
| Dataset | Source | What It Covers |
|---|---|---|
| FRED | Federal Reserve Bank of St. Louis | 800,000+ economic series — GDP, CPI, unemployment, rates |
| BLS APIs | Bureau of Labor Statistics | Employment, wages, price indexes by industry and geography |
| American Community Survey | US Census Bureau | Demographics, income, education, housing by geography |
| World Bank Open Data | World Bank | Global development indicators across 200+ countries |
| Our World in Data | Oxford / Global Change Data Lab | Cleaned, well-cited global data on health, energy, poverty |
| data.gov | US Federal Government | Hundreds of agency datasets across domains |
| Yahoo Finance / yfinance | Financial markets | Historical equity prices, widely cited, easy to cross-check |
None of these require special access, paid subscriptions, or complex authentication. They are available to anyone — which is exactly the point. The stakeholder could pull the same data themselves if they wanted to verify your numbers. That option is what makes the data trustworthy.
The Credibility Transfer in Practice
Consider the difference between these two analytical deliverables:
Version A: A report showing your company’s customer retention rate by region, built on internal CRM data the stakeholder has never examined directly.
Version B: A report benchmarking your company’s pricing strategy against regional inflation indices from FRED, alongside Census household income trends by market.
In Version A, every number is a question. Where did this come from? Are we counting the right customers? Is this data clean? The stakeholder needs to trust your data pipeline before they can engage with your finding.
In Version B, the external numbers are independently verifiable. The stakeholder has seen CPI data before. They can look up the regional inflation rate themselves. Your internal proprietary analysis sits inside a frame of external data they already trust — and that trust transfers to everything adjacent to it.
This does not mean proprietary analysis is less valuable. It means the credibility of well-known external data is the lever you use to establish that the proprietary analysis is worth engaging with.
Building Automation on a Trusted Foundation
The second advantage of public datasets is that they are stable and repeatable — which makes them ideal foundations for automated pipelines.
A stakeholder who trusts the underlying data will say yes to automation faster. “We should have a script that pulls the latest unemployment data from BLS every month and updates this report automatically” is an easy conversation when the data itself is already trusted. The automation becomes the obvious next step rather than a new risk to evaluate.
Here is a minimal example using the FRED API. A free API key is available at fred.stlouisfed.org:
import requests
import sqlite3

FRED_BASE = "https://api.stlouisfed.org/fred/series/observations"
API_KEY = "your_fred_api_key"

def fetch_fred_series(series_id: str, start_date: str) -> list[dict]:
    params = {
        "series_id": series_id,
        "api_key": API_KEY,
        "file_type": "json",
        "observation_start": start_date,
    }
    response = requests.get(FRED_BASE, params=params)
    response.raise_for_status()
    return response.json()["observations"]

def save_to_db(records: list[dict], series_id: str, db_path: str) -> None:
    con = sqlite3.connect(db_path)
    con.execute("""
        CREATE TABLE IF NOT EXISTS fred_observations (
            series_id TEXT,
            date TEXT,
            value TEXT,
            PRIMARY KEY (series_id, date)
        )
    """)
    con.executemany(
        "INSERT OR REPLACE INTO fred_observations VALUES (?, ?, ?)",
        [(series_id, r["date"], r["value"]) for r in records],
    )
    con.commit()
    con.close()

if __name__ == "__main__":
    records = fetch_fred_series("UNRATE", "2020-01-01")  # unemployment rate
    save_to_db(records, "UNRATE", "economic_data.db")
    print(f"Stored {len(records)} observations")
This pattern — pull, store, upsert — is the same for every public dataset. It runs in under two seconds, can be scheduled via cron or a workflow orchestrator, and produces a local database that is trivial to query.
Once the pipeline runs reliably, the analytics layer can be built on top without worrying about whether the data source will change format, lose availability, or require renegotiated access. Public statistical agencies publish stable APIs with long deprecation windows. The infrastructure investment is durable.
The time savings compound quickly. A report that ran manually every month — log in, download, clean, paste into a template, send — now runs unattended. The analyst’s time shifts from data wrangling to interpretation. The stakeholder gets fresher numbers with less lag. Both outcomes happen because the underlying data was stable enough to automate against.
Analytics on a Known Baseline
The analytical power of public data is not the data itself — it is the baseline.
When you know what normal looks like from an authoritative external source, you can identify when your internal data deviates from it. That deviation is often where the real insight lives.
Employment data from BLS tells you what the labor market looks like nationally. If your company’s voluntary turnover rate diverges from the national trend, that divergence warrants investigation. You would not have known to look without the external baseline.
CPI data tells you what inflation looks like. If your supplier costs are rising faster than CPI, you have a vendor-specific problem, not a macroeconomic one. That distinction changes the action you take.
World Bank population data tells you how your total addressable market is growing by country. If your international sales are growing more slowly than the addressable market, the gap is a lead indicator worth examining.
External baseline: What is true for the world
Internal data:     What is true for your organization
The gap:           Where you diverge from expected, and why
The analytics is in the divergence. The public data is the ruler you use to measure it. And crucially, when you present that divergence to a stakeholder, they can verify the ruler. They cannot falsify the gap with “I don’t trust your data” — they trust half of the equation independently, which forces engagement with the other half.
The Graduation Path
Starting with public data is not a permanent constraint — it is a deliberate sequence.
Phase one: Build the analytics framework on data the stakeholder already trusts. The methodology gets validated on ground both parties can verify independently. The pipeline runs. The outputs match what the stakeholder expects to see. Trust is established.
Phase two: Introduce internal proprietary data. The stakeholder’s prior validation of the methodology transfers. “We already know this approach works on FRED data; now we’re applying the same logic to our internal metrics” is a much easier conversation than “trust this new framework built on data you haven’t seen.”
Phase three: Automate the full pipeline — external and internal — and focus analytical effort on interpretation. The data refreshes itself. Anomaly alerts surface automatically. Human attention is reserved for the decisions that pipeline-derived signals trigger.
Phase 1: Known public data → Credibility established
Phase 2: + Internal data → Proprietary insight on trusted base
Phase 3: + Automation → Analyst time shifts from collection to interpretation
Each phase builds on the prior one. Phase three is only credible because phase one happened. The trust earned on familiar data carries forward to every subsequent layer.
Where to Start
If you have not built on public data before, FRED is the lowest-friction starting point. Free API key, excellent documentation, 800,000+ economic series, stable JSON output. The unemployment rate (UNRATE) and CPI (CPIAUCSL) are recognizable to almost any stakeholder in almost any industry.
If your work is more geographic, the Census Bureau’s API covers the American Community Survey with demographic and economic variables down to the census tract level. You can pull income, educational attainment, and population by ZIP code and benchmark anything geography-dependent against it.
If your domain is global, Our World in Data provides cleaned, well-documented CSV exports on hundreds of topics. The cleaning work has already been done, the methodology is cited, and the data is widely referenced in academic and policy contexts — which means your stakeholder has likely encountered it before.
Start with one series. Pull it. Store it. Plot it. Show a stakeholder who already knows what it should look like. Let them verify your numbers against their own knowledge.
That verification — the moment they nod and say “yes, that matches what I’d expect” — is the foundation everything else is built on.
Related Articles
- Getting Started with Data Collection — The workflow for pulling, storing, and organizing data from any source.
- Building Your First Data Pipeline — Automating the collection step so you stop pulling data by hand.
- Scheduling and Automating Pipelines — Keeping your data fresh without manual intervention.
- Low Hanging Fruit Reduces Risk and Builds the Expertise to Climb Higher — The strategic case for starting small and earning trust before expanding scope.