Contents
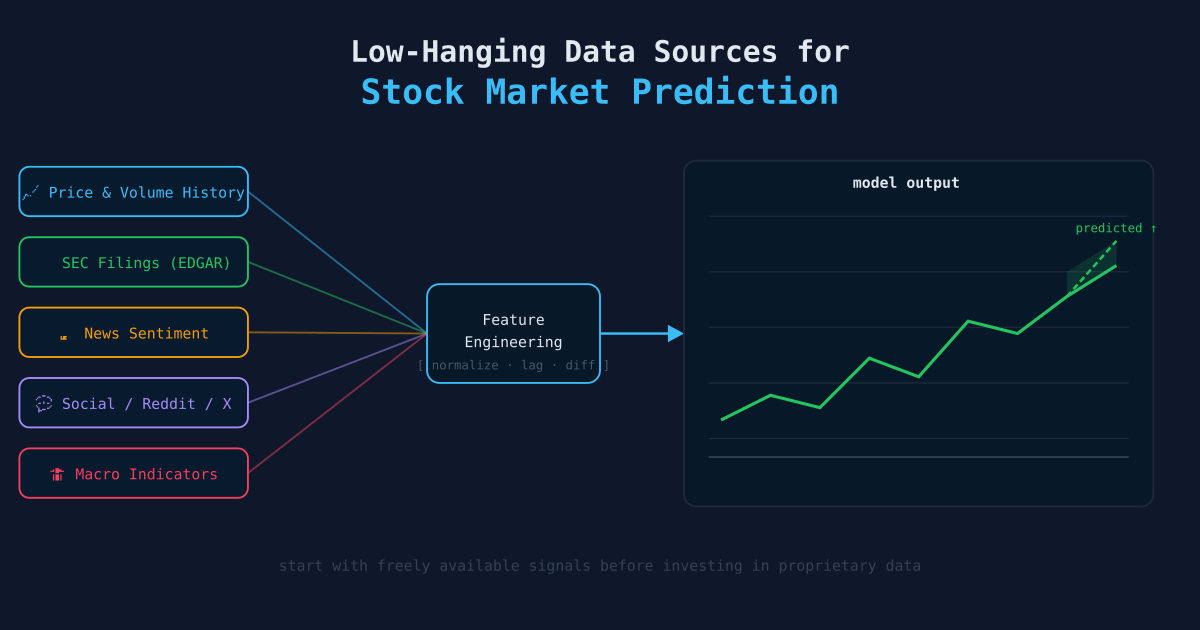
Low-Hanging Data Sources for Stock Market Prediction
🌳 High Hanging Fruit
When building a machine learning model around NYSE stock prediction — as explored in Petrillo (2020) Stock Change Prediction Utilizing Social Media Pools — the biggest gains often come from adding more signal before tuning model parameters. The sources below are all freely accessible, have Python libraries or APIs, and are backed by peer-reviewed research. They are ordered roughly by ease of integration.
1. Twitter / X Sentiment
Core reference: Bollen, J., Mao, H., & Zeng, X. (2011). Twitter mood predicts the stock market. Journal of Computational Science, 2(1), 1–8.
One of the most cited papers in computational finance. The authors ran Granger causality tests between Twitter mood scores (calm, alert, sure, vital, kind, happy) and the Dow Jones Industrial Average — finding that certain mood dimensions predicted market moves 2–6 days out with ~87% accuracy. The methodology maps directly onto a Reddit-based pipeline: replace PRAW with the Twitter API v2, swap subreddits for finance-adjacent hashtags or accounts, and feed the sentiment scores into the same SVM feature set.
Why it’s low-hanging: The tweepy Python library mirrors PRAW in structure. The free API tier gives enough volume for research purposes.
Integration tip: Filter by cashtags ($AAPL, $SPY) rather than keywords to reduce noise and match the stock-specific focus of the existing model.
2. Google Trends
Core reference: Preis, T., Moat, H. S., & Stanley, H. E. (2013). Quantifying trading behavior in financial markets using Google Trends. Scientific Reports, 3, 1684.
The researchers found that increases in Google search volume for finance-related terms (e.g., “debt,” “portfolio,” “stocks”) preceded market downturns. The signal is an attention indicator — when more people are searching for a term, it reflects rising concern or interest before it materializes in price action.
Why it’s low-hanging: Google provides this data free via the pytrends unofficial Python library. No API key required. The data aligns naturally with the 30-minute interval structure since Trends can be queried at hourly granularity for recent periods.
from pytrends.request import TrendReq

pytrends = TrendReq()
pytrends.build_payload(["stocks", "recession", "buy stocks"], timeframe="now 7-d")
df = pytrends.interest_over_time()
Integration tip: Query ticker-specific terms ("Apple stock", "NVDA") alongside broad fear terms ("market crash") to get both stock-level and macro-level signals.
3. Replacing TextBlob with Finance-Specific NLP
Core reference: Loughran, T., & McDonald, B. (2011). When is a liability not a liability? Textual analysis, dictionaries, and 10-Ks. Journal of Finance, 66(1), 35–65.
The Petrillo (2020) paper uses TextBlob for sentiment analysis, which was trained on general-purpose text (movie reviews). The Loughran-McDonald (LM) dictionary was purpose-built for financial documents — words like “liability,” “risk,” and “volatile” are negative in finance but neutral in everyday English. TextBlob misclassifies these systematically.
Why it’s low-hanging: The LM dictionary is freely downloadable as a CSV. Integrating it is a drop-in replacement — load the word lists, score each Reddit comment against them, and replace the polarity column.
Also consider: VADER (Hutto, C. & Gilbert, E., 2014. VADER: A parsimonious rule-based model for sentiment analysis of social media text. ICWSM.) — optimized for social media text, handles slang, caps, and punctuation weighting better than TextBlob. Available via pip install vaderSentiment.
4. Wikipedia Page Traffic
Core reference: Moat, H. S., Curme, C., Avakian, A., Kenett, D. Y., Stanley, H. E., & Preis, T. (2013). Quantifying Wikipedia usage patterns before stock market moves. Scientific Reports, 3, 1801.
Wikipedia page view counts for company articles and financial concepts were shown to precede stock price changes — when view counts for a stock’s Wikipedia page spike, a price move (typically downward) follows within weeks. It captures a different form of attention than search volume: deeper research intent rather than casual curiosity.
Why it’s low-hanging: The Wikimedia REST API is fully public, requires no key, and returns hourly page view data.
import requests

url = "https://wikimedia.org/api/rest_v1/metrics/pageviews/per-article/en.wikipedia.org/all-access/all-agents/Apple_Inc./daily/2020010100/2020042300"
response = requests.get(url)
data = response.json()
Integration tip: Pull views for each of the 10 ticker company pages (Apple Inc., Amazon, Tesla, etc.) and use the delta in views as a feature alongside the existing Reddit metrics.
5. Financial News Headline Sentiment
Core reference: Tetlock, P. C. (2007). Giving content to investor sentiment: The role of media in the stock market. Journal of Finance, 62(3), 1139–1168.
Tetlock found that the fraction of negative words in Wall Street Journal columns predicted next-day market returns and trading volume. News headlines are a faster-moving and less noisy signal than forum posts — they are written by professionals and carry market-moving information.
Why it’s low-hanging: newsapi.org provides a free tier (100 requests/day) with full-text headline search. The feedparser library can also pull RSS feeds from Reuters, AP, and MarketWatch without authentication.
from newsapi import NewsApiClient

newsapi = NewsApiClient(api_key="YOUR_KEY")
articles = newsapi.get_everything(q="Apple stock", language="en", sort_by="publishedAt")
Integration tip: Score headlines with the LM dictionary (see above) and aggregate by ticker within each 30-minute window to create a headline_sentiment feature that runs parallel to the Reddit sentiment features.
6. SEC EDGAR Filings
Core reference: Loughran, T., & McDonald, B. (2016). Textual analysis in accounting and finance: A survey. Journal of Accounting Research, 54(4), 1187–1230.
10-K and 10-Q filings contain forward-looking statements, risk factors, and management discussion sections that carry predictive content. Changes in the tone of these filings — more negative language year-over-year — correlate with subsequent stock underperformance.
Why it’s low-hanging: SEC EDGAR is a free, public API. The sec-api Python wrapper simplifies retrieval. This source is lower-frequency (quarterly) so it serves as a baseline feature rather than a real-time signal.
import requests

url = "https://data.sec.gov/submissions/CIK0000320193.json"  # Apple
response = requests.get(url, headers={"User-Agent": "research@example.com"})
filings = response.json()
7. VIX and Macro Fear Indicators
Already in the dataset — the Petrillo (2020) paper includes ^VIX as one of the 10 tracked symbols. The research below supports expanding how it is used:
Core reference: Whaley, R. E. (2009). Understanding the VIX. Journal of Portfolio Management, 35(3), 98–105.
Rather than using VIX as a raw price level, computing the VIX delta (day-over-day change) and the VIX term structure (short vs. long dated implied volatility) provides richer features. Rapid VIX spikes are systematically associated with mean-reverting moves in the S&P 500.
Integration tip: Add vix_delta as a feature alongside the existing ^VIX price — this is a one-line change to the existing NYSE metrics pipeline.
Priority Ranking for Implementation
| Priority | Source | Effort | Expected Lift |
|---|---|---|---|
| 1 | VADER replacement for TextBlob | Low — pip install swap | Medium — better social text scoring |
| 2 | Google Trends (pytrends) | Low — no API key | High — proven predictor |
| 3 | Wikipedia page views | Low — no API key | Medium — attention signal |
| 4 | LM Financial Dictionary | Low — CSV download | High — finance-specific NLP |
| 5 | News headlines (newsapi) | Medium — free key needed | High — professional signal |
| 6 | Twitter/X (tweepy) | Medium — API key + rate limits | High — real-time sentiment |
| 7 | VIX delta feature | Trivial — existing data | Low-Medium — refinement |
| 8 | SEC EDGAR filings | High — parsing complexity | Medium — low-frequency signal |
References
- Bollen, J., Mao, H., & Zeng, X. (2011). Twitter mood predicts the stock market. Journal of Computational Science, 2(1), 1–8.
- Hutto, C., & Gilbert, E. (2014). VADER: A parsimonious rule-based model for sentiment analysis of social media text. Proceedings of ICWSM.
- Loughran, T., & McDonald, B. (2011). When is a liability not a liability? Textual analysis, dictionaries, and 10-Ks. Journal of Finance, 66(1), 35–65.
- Loughran, T., & McDonald, B. (2016). Textual analysis in accounting and finance: A survey. Journal of Accounting Research, 54(4), 1187–1230.
- Moat, H. S., Curme, C., Avakian, A., Kenett, D. Y., Stanley, H. E., & Preis, T. (2013). Quantifying Wikipedia usage patterns before stock market moves. Scientific Reports, 3, 1801.
- Petrillo, M. (2020). Stock change prediction utilizing social media pools. Colorado State University – Global Campus.
- Preis, T., Moat, H. S., & Stanley, H. E. (2013). Quantifying trading behavior in financial markets using Google Trends. Scientific Reports, 3, 1684.
- Tetlock, P. C. (2007). Giving content to investor sentiment: The role of media in the stock market. Journal of Finance, 62(3), 1139–1168.
- Whaley, R. E. (2009). Understanding the VIX. Journal of Portfolio Management, 35(3), 98–105.
Related Articles
- DuckDB for Financial Data Analysis — Storing and querying the market data these sources generate, without spinning up a full database server.
- Pulling Data from REST APIs — The underlying patterns for fetching paginated data, handling rate limits, and saving raw responses.
- Building a Stock Prediction Classifier with scikit-learn — Putting these data sources to work in an actual prediction model.